


Wall Street's Rise of the Living Dead
Record valuations among zombie corporations and story stocks confirm the greatest mania of all time; I detail four strategies for profiting from Mr. Market's madness

The zombification of corporate America has reached a disturbing new record.
A “zombie corporation” is a business that doesn’t earn enough pre-tax income to cover the interest expense on its debt. The very existence of these companies relies upon endlessly issuing new debt to repay the old.
The chart below reveals the stunning surge in value among these corporate undead - approaching a record $6 trillion, and blowing out all previous records:

Yet another artifact of the greatest mania of all time. New signposts appear with each passing day. Consider the case of newly minted electric vehicle company Rivian Automotive (RIVN). Rivian went public on November 10th, and recently sported a valuation exceeding $100 billion. The punchline? Rivian hasn’t yet sold a single vehicle.
No sales? No problem. Today’s speculators happily price Rivian shares as if the company sells 10 million cars a year. Why? Because the only requirement for making money on Rivian stock is a supply of greater fools, willing to buy at ever-higher prices.
Against this backdrop, the chorus of skeptical voices grows louder with each passing day. Last week, Bill Ackman became the latest billionaire investor to label today’s market a Fed-fueled bubble.
Of course, he’s right… but that’s not stopping the stock market from posting new record highs with each passing week. The market continues climbing a steep wall of worry, with no indication that things will change anytime soon. And therein lies the trillion dollar quagmire…
What’s an Investor to Do in This Environment?
In today’s article, I’ll review four key opportunities for profiting in today’s manic stock market, including:
Long-duration Treasuries, as today’s transitory inflationary shifts reverts to deflation in 2022+
Top-tier energy stocks, many of which sport double-digit free cash flow yields and 5 - 8% annual dividends, even in a lower price environment
A short-to-medium term bet on falling natural gas prices, as fears of a winter storage crunch dissipate.
A short term bet on an imminent melt up in U.S. stocks
Let’s start with long duration Treasuries - my highest conviction idea in today’s market.
Bond Market Rejects Consensus Inflation Narrative
It’s easy to forget that, as recently as February of this year, inflation was running below 2%. And after just eight months of hot inflation prints, the consensus view expects a decade of devastating 1970s-style inflation. The notion that supply chain disruptions, plus the largest fiscal stimulus of all time, might prove “transitory” factors in boosting prices is dismissed as delusion among the majority opinion.
And yet, that’s exactly what Mr. Bond Market continues pricing into long duration Treasury yields. As of Friday, the 30-year yield is once again back below 2%. Meanwhile, with fund managers the most pessimistic on bonds in the last two decades (per Bank of America’s Fund Manager Survey), I believe long bonds present a tremendous contrarian opportunity.
As covered in previous articles, long bonds often sell off ahead of an expected Fed tightening announcement. This provides an initial head fake lower, before long bonds reverse and break out higher during the actual tightening process. The iShares 20+ Year Treasury ETF (TLT) is following this textbook “fake out then break out” pattern - with initial selling pressure going into the official November Fed taper announcement, before reversing higher upon the actual commencement of tapering.
Meanwhile, on November 10th, the U.S. Bureau of Labor Statistics reported the hottest inflation print in 30 years - a 6.2% annualized increase in the consumer price index. Long duration bonds sold off hard on the news… for all of five trading days, before once again reversing higher.
Despite this gauntlet of negative news, TLT continues carving out a series of higher lows and higher highs, suggesting the path of least resistance is higher from here:

In the medium and longer-term, the macro data also supports a contrarian “transitory” take on today’s inflation. The chart below explains why - with producers increasingly unable to pass along higher prices to consumers:

As shown in the chart, the last two episodes when producer prices accelerated much faster than consumer prices, the economy either suffered a recession or a deflationary bear market in commodities.
Is this time different?
The next chart suggests not - with consumer sentiment crashing on the back of spiking inflation, making consumers more pessimistic than at the depths of the COVID-19 outbreak:

With wages failing to keep up with inflation, and producers struggling to pass higher prices to consumers, the objective data favors camp transitory. That’s also the message we can take from Mr. Bond Market, who enjoys an enviable track record of anticipating future trends in growth and inflation.
But here’s the thing… you don’t have to make an all or nothing bet on inflation versus deflation. Despite believing that today’s inflation is indeed transitory, I’m extremely bullish on energy stocks - a sector that historically delivers its best performance during inflationary periods.
This bullish stance is independent of the broader trends in consumer prices. Instead, I’m focused purely on the unique supply/demand dynamics, which look the most bullish in at least the last decade.
Oil: It’s a Bull Market, and Politicians Can’t Stop It
In commodities, it’s not a real bull market until the politicians begin grandstanding about price gouging and windfall profits. That’s precisely where things stand in today’s oil market, including the following commentary from Massachusetts Senator Elizabeth Warren last week on MSNBC:

Anyone with a cursory understanding of the oil and gas industry, or commodities markets in general, can appreciate the sheer absurdity on display here. Let’s invert Senator Warren’s logic, and consider a few questions…
If oil companies could price gouge at will, why did they spend the last decade literally losing hundreds of billions of dollars? Did investors and corporate executives suddenly get together in 2021 and start asking - hey, you know what? Instead of destroying shareholder oversupplying the market with artificially cheap energy, maybe we should try this price gouging thing instead?
Or, are we simply dealing with a normal commodity cycle? Where yesterday’s low prices and negative returns on capital created an impairment in supply, leading to today’s higher prices? One look at current U.S. oil production and inventory trends shows that this is exactly what’s happening. At the key storage hub in Cushing Oklahoma, U.S. oil inventories have fallen to the lowest levels of the last five years:
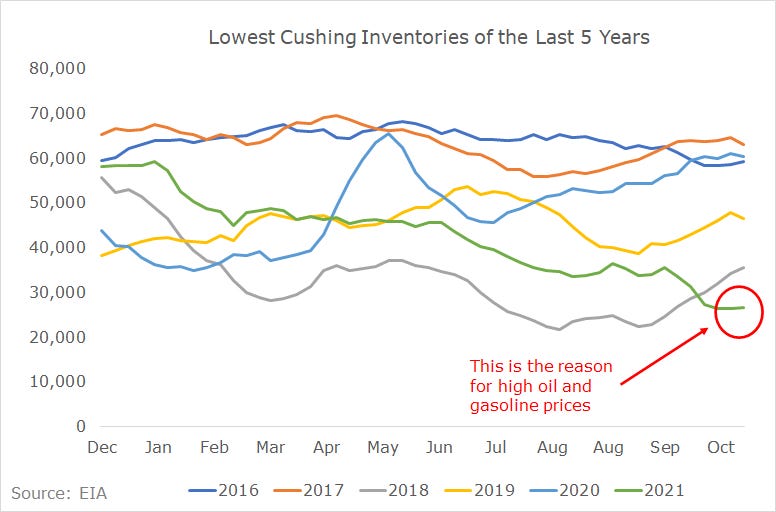
There’s no price gouging here. The objective data shows that basic supply/demand dynamics are driving prices higher. Sure, the political jawboning - including the potential release of oil from strategic reserves - can pressure short term oil prices. Meanwhile, the political threat of taxing or otherwise “making big oil pay” for higher prices at the pump has created an overhang on energy share prices. But make no mistake…
This weakness in energy prices and energy stocks is a buying opportunity.
Why? Because there’s nothing politicians can do about today’s high energy prices.
Politicians Powerless to Stop Today’s Energy Bull Market
The solution for high commodities prices is simple: add more supply. More supply requires more investment. By threatening the oil industry with punitive measures, whether it’s anti-price gouging efforts or otherwise, politicians will only further discourage investment, and thus further impair future supply.
Meanwhile, jawboning prices lower through threats or action on strategic reserve releases can lower prices in the short term. But here again, lower prices will only further reduce investment, and thus further impair future supply.
Plus, drawing down strategic reserves removes buffering capacity against future supply shortages. This again only sets the stage for even greater upward price pressure longer term.
Absent more investment and more supply, the only alternative solution to higher prices is less demand. But there’s no sign of a demand slowdown - in fact, quite the opposite. The latest data from GasBuddy shows that weekly U.S. gasoline demand rose to the highest levels since late August last week:

Meanwhile, air travel also continues staging a robust recovery. TSA data from last Friday registered the highest number of air travelers since the start of the pandemic, reclaiming March 2020 levels. Given the steady rebound in demand across all key oil-consuming sectors, it’s no surprise that the latest EIA projection calls for new record highs in global crude oil consumption in 2022.
Thinking globally, with U.S. oil investment now impaired, OPEC is no longer fighting the shale patch for market share. This has created a more cohesive cartel, more committed to managing prices. Add it all up, and all signs indicate we’re now in an environment where global oil producers are now quicker to cut production during downturns, and slower to increase production in upcycles.
The end result: today’s supply dynamics indicate a higher floor and higher ceiling on prices through the cycle. This is a major change from the last decade, where every downturn was met with a flood of cheap capital, ultimately depressing returns below zero for the entire industry.
Even at $60 oil, best-in-class operators can earn double-digit cash flows yields and support 5 - 8% annual dividends. And in the event of a recession, the strong names with the best balance sheets will repurchase their own shares and/or buy distressed assets - not flood the market with excess production.
This is the most bullish backdrop for energy investors of the last decade.
That’s why I view any weakness from current levels as a buying opportunity among high-quality energy names across the spectrum, including upstream, midstream and downstream businesses. Click the subscribe button below to see the energy names and other ideas I’m tracking in a complete portfolio, with real-time alerts:
Beyond this bullish view on oil, I’m also seeing a shorter-term opportunity to capitalize on a substantial mispricing in the natural gas market.
Mother Nature Fails to Deliver
I’ve written extensively on the irrational exuberance in Henry Hub gas prices, which trade as if the U.S. could face a European-style storage crunch. The objective data indicates a well-supplied U.S. natural gas market. My working thesis for months has been, outside of extreme weather, the U.S. gas storage deficit would narrow and push prices back into sub-$4 territory.
The last several weeks of data have confirmed this thesis.
Normal November weather has all but erased the previous gas storage deficit - now down to less than 100 billion cubic feet (bcf) versus the five year average. Continued normal or warm weather will eventually flip the U.S. gas market into a surplus:

Meanwhile, the recent December temperature outlook from the NOAA spells big trouble for gas bulls betting on mother nature riding to the rescue for an extreme weather event this winter:

This December forecast is a big deal. Let me explain why…
The Critical Window for Gas Bulls is Closing
When it comes to winter natural gas consumption, bulls have three key months to capitalize on extreme cold - December, January and February. You can see this in the chart below, showing monthly gas consumption for the residential and commercial sectors (i.e. winter heating demand) over the last five years:
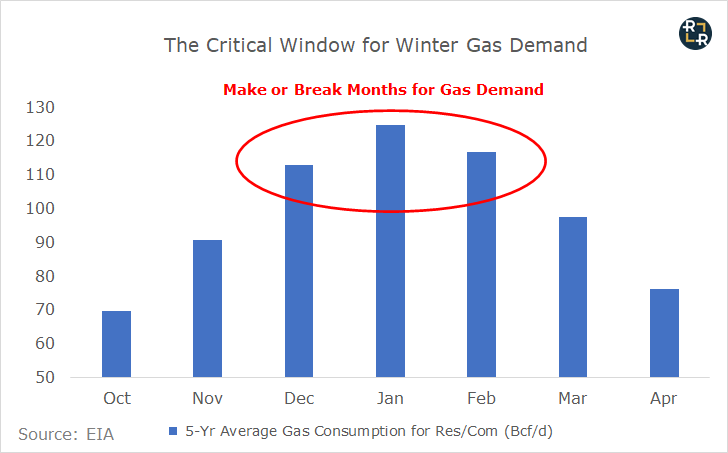
Given this consumption distribution, it’s no surprise that gas prices tend to peak in the December - February time frame. This includes the two prior price spikes over the last decade, in February 2014 and December 2018. If the NOAA December forecast holds, the bulls betting on an outlier in winter gas demand just got one of their three legs kicked out from under them.
The current disparity between U.S. oil and gas supply trends reveals some basic, yet illuminating insights into what politicians can focus on if they hope to lower prices at the pump.
A Lesson for Politicians Hoping to Lower Prices at the Pump
First, private operators produce a greater share of natural gas versus oil in the U.S. And in today’s environment, private operators are finding it much easier to add rigs and invest in production growth versus their public counterparts. Why? Because public investors are demanding shareholder returns over growth, and that’s helping starve investment into U.S. oil output.
Lesson one: more investment creates more supply.
Second, prices for natural gas have enjoyed a much stronger rebound than oil in recent months. Producers have responded to the profit incentive with more production, and will likely continue growing production at current prices.
Lesson two: higher prices creates more supply.
The corollaries here should be obvious: any efforts to discourage investment, or artificially suppress prices, will only backfire - resulting in less supply and higher prices longer term.
Yes, I appreciate how pedantic this all sounds… but sadly, the people in charge literally fail to understand economics 101.
As a final note on natural gas - despite this short-term bearish bias, I remain bullish top tier natural gas producers in the long run. My view is that gas prices will revert towards the marginal cost of production, perhaps with some additional upside to account for the capital impairment in the sector. That translates into roughly $3 - $3.50 per million cubic feet (mcf), with potential upside to $4 per mcf. Assuming long run average pricing of around $3.50 per mcf, you can find gas-focused E&Ps trading at dirt cheap valuations today.
The bottom lie: compelling opportunities do exist despite the broader market madness. At the same time, opportunities also exist for capitalizing on the mania itself.
Capitalizing on Today’s Mania
Last week, I made the case for a melt up into year-end, based on the confluence of record money flows, option volumes and seasonal performance chasing driving prices higher into year-end, regardless of all other fundamental considerations. Since then, I’ve detailed a series of options trades designed to generate 5 - 10x upside per unit of risk.
Here’s where the trade stands today, based on the latest weekly money flow and option volume data…