


Natural Gas Could Crash without a Cold Winter
Traders have mistakenly priced U.S. gas as though America is facing a European-style shortage

The long-term prospects for the natural gas (and oil) investor have never looked better.
In the short-term, however, U.S. gas traders have gotten ahead of themselves. They have mistakenly extrapolated the real European gas shortage into a perceived shortage in the U.S. market, setting the stage for a contrarian trading opportunity.
That’s right, I want to short natural gas.
But before you send the hate mail, let me reiterate: this is a short-term trade. In future articles, I’ll continue making the long-term case for today’s generational opportunity for oil and gas investors (as it turns out, I’ve already done that here and here).
Also, one giant disclaimer before getting started…
If you’re new to winter gas trading, please appreciate that mother nature is a massive wild card. No one can predict what she’ll do with any certainty more than two weeks out (at least no one I’ve ever met). So without a plan to manage risk through the outliers, your best bet is to avoid natural gas, the commodity, altogether.
In short, don’t be That Guy. You know, the one who trades natural gas in the winter without risk management:

With that out of the way, let’s get started…
From COVID-Driven Glut to Weather-Driven Deficit
To understand where things stand in today’s gas market, let’s first rewind the clock to see how we got here. Starting in early 2020, the COVID-19 outbreak created a glut of commodities across the board, including both natural gas and liquefied natural gas (LNG).
Depressed prices took roughly half of U.S. LNG export capacity offline, creating an oversupplied domestic gas market in the first half of 2020. The U.S. market then began balancing as the global LNG market tightened, when full U.S. export capacity came back online in late 2020.
Then, a series of extreme weather events accelerated the market’s balancing act, starting with the February Freeze across the entire middle of the country earlier this year:
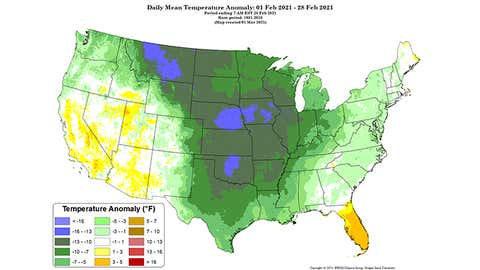
During the peak mid-February cold blast, nearly 200 cold weather records were tied or broken in territory spanning from North Dakota to Texas. Naturally, this helped drawdown huge volumes of gas inventory, transforming the previous glut into a modest storage deficit.
Temperatures normalized just enough for the market to recover the deficit, before extreme heat pushed gas demand to new seasonal records once again in June. The NOAA reported that this summer’s average temperature set new all-time highs, at 2.6 degrees above normal on average. This translated into record power generation, and thus record summer gas demand. Gas-fired power plants averaged 5.0 million megawatt hours per day this past June, or 4% more than the previous June record.
Add it all up, and you can trace exactly how the market evolved - with the “February Freeze” creating an initial deficit, followed by a brief market rebalancing, before record heat reignited the deficit:

More recently, you can see the deficit impact from a minor disruption in U.S. production in late August. That was courtesy of Hurricane Ida, which took roughly 2 Bcf/d of dry gas offline in the the Gulf of Mexico. This production has been slow to restart, as shown in this shorter-term production estimate from Blue Gold Trader (@bluegoldr):

But if we step back to take in the big picture, there’s two critical points to consider in this year’s sequence of events…
First, the market quickly erased the storage deficit from the February Freeze, before the record heat started up in June. That tells you the market was well supplied heading into the summer on a weather-neutral basis. Then, of course, June’s record consumption blew out the deficit once again. But here’s where things get interesting…
In July, we still had some incredible heat… it just wasn’t the hottest July on record. Specifically, it was the 13th hottest on record and 1.9 degrees above the 20th century average, per the NOAA. Then, despite a slightly more mild August, the distribution of that heat was focused on the critical population centers on the coastal U.S. That translated into the 2nd largest cooling demand for August on record, going back to 1950, according to weather-consulting agency BAMWX.
In other words, June’s blowout heat created a pretty decent gas deficit. However, July and August were nothing to sneeze at. We’re talking only slightly below-record setting months. And yet, despite this extreme heat, the U.S. storage deficit went precisely nowhere from early July through mid-August (before Hurricane Ida showed up):

So, here’s the bottom line…
Under normal temperature conditions, the U.S. gas market is well supplied.
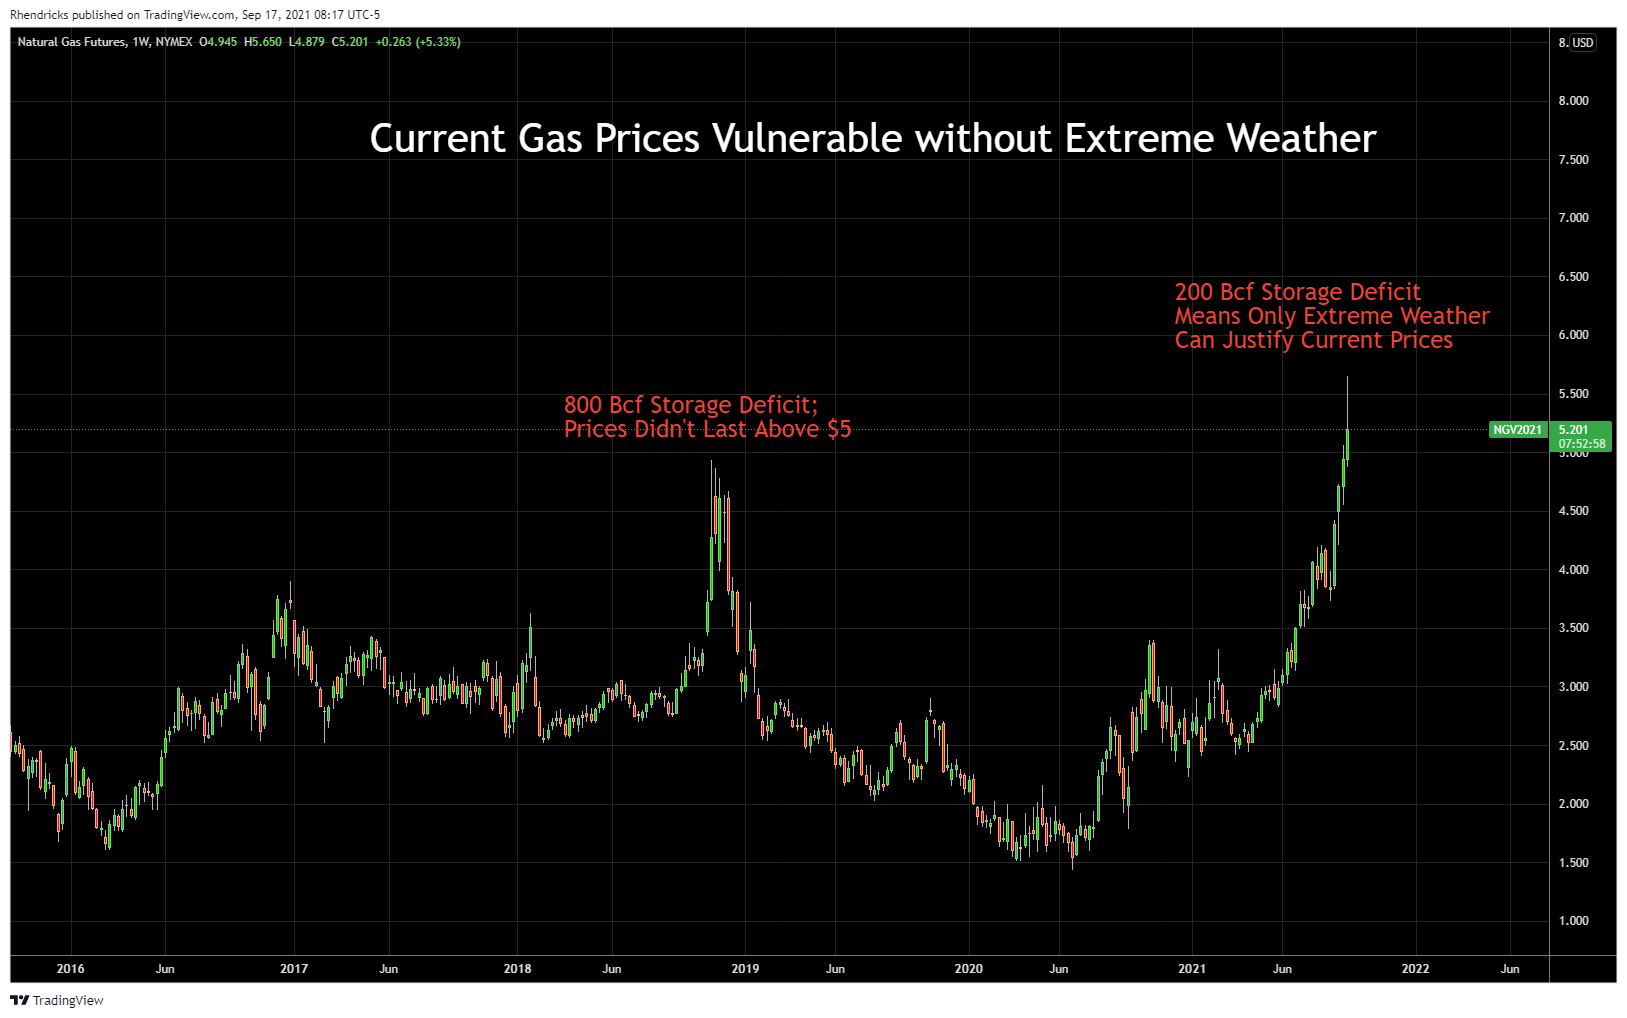
Meanwhile, even with the extreme summer demand, today’s current storage deficit is modest. We’ve seen much worse, back in 2018, when prices briefly spiked above $5 before ultimately crashing back below $3. If the 800 billion cubic foot (Bcf) deficit in 2018 wasn’t treated as a crisis, it’s hard to imagine why today’s roughly 200 Bcf deficit is getting so much respect from Mr. Market:

Sure, with cold enough winter weather, the storage deficit could grow. But with winter gas trading between $5 - $5.50, all but the most dire weather scenarios have already been priced in.
Looking beyond weather factors this winter, the demand side of the equation is relatively capped. U.S. LNG exports are constrained by infrastructure, not economics. So while here’s a theoretical arbitrage between U.S. gas at $5 and European gas at $25… who cares? Without new export terminals, this arbitrage opportunity only puts a floor under operating capacity. The same applies to pipeline exports into Mexico.
Next, what about the supply side? As shown earlier, the recent dip in production is due to Ida-related shutdowns in the Gulf of Mexico. But the popular narrative that no one is growing production in today’s market is simply untrue. Over in the Haynesville, current EIA estimates show producers ramping production to new record highs as recently as last Spring - well before the recent price rally, with gas prices at around $3:

Looking at all shale gas, we see production has already fully recovered from the COVID-driven declines, and has been pressing up against new record highs since May. Will shale producers remain on the sidelines now with spot prices over $5, and forward prices in the $3 - $4 range going out several years?

If you listen to the latest quarterly conference calls from the major gas-focused E&Ps, the key threshold management teams are waiting for is gas over $3 across the forward strip. Consider the following guidance from America’s largest dry gas producer, EQT, on the company’s second quarter earnings call:
Consistent with what we have seen in the past and when we get the question, what would it take for EQT to grow, we have consistently said, it would require a strip that’s got some length to it probably 2 years to 3 years out at a gas price that’s north of $3.
Thanks to the blistering rally over the last several weeks, that condition now officially exists - with gas trading comfortably over $3 going out to winter 2024.
The good news for long term investors is that companies like EQT can mint money at today’s prices. EQT’s cash flow yield will exceed 20% at $3.50 gas (stay tuned for future updates where I’ll do the deep dive).
In the long run, the tailwinds of capital restraint and secular demand growth all remain in tact for natural gas. “Lower for longer” U.S. energy prices is a dead phenomena. $3 Henry Hub is likely a floor, rather than a ceiling from here on out. But that doesn’t mean prices should trade at $5 in the absence of a meaningful storage deficit.
In the short-term, traders fixated on the record breaking bull market in European gas have falsely extrapolated a similar situation here in America. But America ain’t Europe. We’ve got plenty of gas in this country, both in storage and behind pipe, available to come online in short order at the right price.
So here’s the simple bet I’m placing to capitalize on this irrational exuberance.
How to Bet on a Gas Crash
The ProShares Ultrashort Natural Gas ETF (KOLD) tracks the inverse daily price of natural gas, leveraged two times. This is an easy way to bet against natural gas prices, without the unlimited risk of shorting futures contracts.
As this article goes to press in pre-market trading on Friday 9/17, KOLD is trading at $9.52:

Remember, natural gas can do crazy things based on unpredictable weather fluctuations and other market disruptions (i.e. hurricanes). So position sizing is key.
As an illustrative example, I’m generally willing to risk roughly 1-3% of my portfolio on any given idea. And for a trade like this, you want to give it room to go against you on any given day or week. So for a hypothetical $100,000 portfolio, I’d use a $10,000 position size. Assuming a stop loss at $3,000 that means I can withstand prices trading below $7 before admitting defeat and taking a loss. That translates into risking no more than 3% of my portfolio.
Every individual has their own risk tolerance. The key is to know exactly how much you’re willing to lose before entering the trade, and size the original position accordingly.
Stay tuned for more updates, and subscribe below to follow this trade and more to come:
Good investing,
Ross Hendricks