


Lehman or Not, Prepare for a Bear Market
Mr. Market has been warning of trouble for months

The 2021 “Lehman Moment” has arrived… or so they said.
I’m talking about the much-feared default of Chinese property giant, Evergrande. After ignoring the growing signs of distress in China’s property market for months, financial markets suddenly awoke to the risks with a sea of red on Monday morning:

Three days later, and Evergrande is now a distant memory. U.S. stocks fully erased their early-week declines, and are pushing back up towards new highs. That’s why the best investors tune out the news - chasing headlines is hazardous for your portfolio’s health.
Now, I’m not saying you should ignore the situation - it’s a real risk. The property market makes up one-third of China’s economic activity. And all signs indicate that it’s massively overbuilt, overleveraged and thus vulnerable to collapse. A major disruption in this market would not only pose a major risk to China’s economy - the fallout would spread across the globe.
But here’s the problem…
No one knows how, or more importantly - when - it all unravels. For every “Lehman Moment”, there’s dozens of false positives along the way. No one ever talks about the subprime hedge funds that started blowing up in early 2007. Or the Bear Stearns implosion in March 2008. For 18 months, the market shrugged off a series of tremors before the big one showed up in the Fall of 2008.
So while Evergrande could be the next Lehman, it could also be the next Bear Stearns. Or, it could be none of the above. But here’s the thing - it doesn’t really matter. The far simpler truth is, the market itself has been warning of a potential shift from boom to bust for months now.
In today’s article, I’ll detail a series of key indicators that have historically preceded bear markets. The upshot? You don’t need to be Michael Burry, or an expert in the Chinese property market, to see the clear warning signs in today’s market.
Let’s get started…
Forget the Catalyst; Focus on Initial Conditions
First, investors should dissolve the notion of requiring a “catalyst” for a bear market. After all, can anyone pinpoint the specific event that triggered the Dot Com bust? Or the 1973-1974 bear market? Or the 1929 peak? The list goes on…
Catalyst or no catalyst, the common ingredient required for any bear market is a preceding state of fragility. One way to measure fragility is to simply consider valuation metrics. Financial asset prices ultimately revert to the mean of underlying earnings power. In today’s market, you can take your pick of basic valuation metrics - price/earnings, price/sales, price/cash flow, etc. - stocks trade at or near record high valuations across the board.
One of my favorite’s is the “Buffett Indicator”, which compares the size of the economy to size of the stock market (S&P 500). Using the Buffett Indicator, U.S. stocks are 30% more overvalued than at the peak of the Dot Com bubble:

The peak of the Dot Com bubble marked the highest valuations in history, at the time. From there, stocks went nowhere for a decade, and lost 50% twice along the way. There was no catalyst for the initial decline starting in March of 2000. The supply of buyers simply dried up at stratospheric valuations, and then prices spent the next decade reverting to the mean.
The bottom line: when you inflate an asset bubble, it’s only a matter of time before that bubble finds a sharp edge. Focusing on finding the catalyst is a distraction. The more valuable exercise is to simply appreciate the fragile nature of the bubble itself. That way, you’re prepared for when the air inevitably starts leaking out.
Now, that doesn’t mean we have to completely ignore the topic of timing. If you learn to listen to the wisdom of Mr. Market, he’ll often send out reliable warning signals through the message of price action. That’s precisely what he’s been doing for the last several months…
The “Confidence Termites” Have Arrived
Historically, one of the most reliable signals preceding a market top is a deterioration in the market’s speculative appetite. You can observe this by watching the market’s leadership. In the early stage of mania, the riskiest securities lead the market. But towards the end, the riskiest securities begin transitioning from leaders to laggards.
In this interview, legendary investor Jeremy Grantham describes this process with a few historical examples:
“In a bull market, the risky stocks go up a lot more than the blue chips. In 1928, the junky low-priced index went up over 80% and the S&P went up about 40%. That’s what you expect. But in 1929, as we approached the cliff edge, the low-priced index began to go down… you had the S&P going up another 40% prior to the crash, but the low priced index was down for the year.”
Grantham went on to note a similar dynamic that preceded the Dot Com crash:
“In 2000 March, they start to take out the internet stocks - the Pet.com’s… A month or two later, they’re shooting at junior growth. And then, a month later or two later, the middle growth. And finally, by mid-to-late summer, they’re shooting even the Cisco’s, which were giant companies.”
“So what had happened, is that the confidence termites, I think of them, had started at the most crazy Pet.com and worked their way down through the Cisco’s… and then finally the arrived at the broad market and the entire market rolled over and fell 50% in two years”
Today, we’re seeing many signs of Grantham’s “confidence termites” eating away at the foundation of this late-stage bull market. Some of the most speculative assets peaked in February, trailing behind the broad market indices that have pressed up towards new record highs.
Two of the key stock baskets I track for measuring performance of high-risk stocks include the ARKK and the IPO exchange traded funds. Each of these funds are filled with negative-cash flowing story stocks, with stratospheric valuations supported by narrative and hype alone.
Last year, these higher-risk funds crushed the S&P 500 (SPY), with ARKK and IPO each returning over 100% versus just 18% for the SPY:

But the roles have reversed in 2021. Despite the SPY returning over 20%, ARKK is negative on the year and IPO is barely clinging to break-even:

Several other key indicators are flashing bright red warning signs, including an inflection point in the use of margin debt.
Key Reversal in Margin Debt
The epidemic of reckless leverage in today’s market deserves its own article (stay tuned - it’s coming!). For now, we can distill the situation into two alarming statistics:
1) 80% of Generation Z investors are taking on debt to fund “investments”
2) Nearly half a trillion in margin debt was taken out during the market rebound from March 2020 through June of this year.
Simply put, we’ve never seen this degree of debt-fueled speculation before, ever. Now, here’s where things get interesting from a timing perspective…
The rate of change in margin debt peaked and started reversing five months ago. The last two times we saw this type of growth in leverage and subsequent reversal, stocks were four to six months away from entering a bear market:

Finally, the last key indicator screaming caution in today’s market comes from the recent price action in Treasury bonds.
Bond Traders Pricing in a Bear Market
The two key factors that drive U.S. Treasury returns include economic growth and inflation expectations. When growth and/or inflation expectations turn higher, bond yields rise, and vice versa.
History shows that no other market competes with Treasuries for reliably pricing in key inflections in growth and inflation. That’s why the bond market is known as the proverbial “smart money” – Treasury traders often telegraph what’s coming in the economy well ahead of everyone else.
A perfect example can be found in the lead up to the Fall of 2008.
Students of market history will recall that 2007 – early 2008 was the “Commodities Supercycle” era. Gold had just broken above $1,000 for the first time ever, agricultural commodities traded at record highs almost across the board, and oil famously ran up to an all-time high of $140 in June 2008.
However, within three short months, the economy flipped from blistering growth and inflation into one of the greatest deflationary busts of all time. Most were caught completely off guard at the time… but not the bond market. Treasury investors saw this bust coming from a mile away.
In the chart below, note that 10-year Treasury yields peaked in mid-2007 and entered into a persistent downtrend over the next 12 months. Importantly, this drop in yields occurred despite inflation surging from 1.9% in August 2007 to over 5% by the summer of 2008. The ultimate warning signal came when yields made a lower low and then rolled over, despite a red hot 5.5% CPI reading reported in July of 2008:
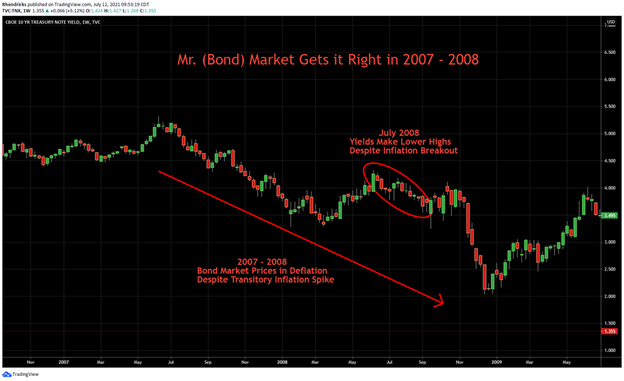
In other words, Mr. Bond Market began sounding alarm bells more than a year ahead of the September 2008 “Lehman Moment.” You didn’t need to be an expert in credit default swaps and subprime mortgages to see what was coming. You just needed to appreciate the unusual divergence between blistering inflation and collapsing Treasury yields. This trend started in mid-2007 and continued all the way into the lead up of the Fall of 2008 - providing 18 months of clear warning.
Of course, the nuances are different in this cycle... but as they say, history rhymes.
In today’s bond market, we’re seeing another, even more extreme divergence between red hot inflation of over 5% and persistently low Treasury yields of less than 1.5% for the 10-year note. Not only have Treasuries failed to keep up with inflation, but they haven’t even reclaimed their pre-COVID levels from early 2020.
In other words, the Treasury market is sounding the loudest alarm bell of them all. Today’s price action is eerily similar to the bond market’s rejection of red hot inflation in July of 2008, suggesting an imminent shift into deflation ahead.
So to summarize…
We’ve got record stock market valuations, record leverage and early signs of speculative exhaustion in the riskiest securities in today’s market. Meanwhile, despite the hottest inflation prints in over a decade, Treasury yields are pricing in an imminent bout of deflation.
So my advice from here - tune out headline makers. Mr. Market is a far more valuable indicator, and he’s been sending off warning signals for months.