


Energy Crisis Threatens Late Stage Economic Expansion
Spiking energy prices are a classic late-cycle phenomena

Another day, another new record high in European natural gas and electricity prices.
What began as a bull market has now transformed into a full blown energy crisis. The chart below paints a scary picture of European traders pricing in a potential gas shortage this winter, with prices at the benchmark Dutch TTF hub soaring from 13 per MW in March to new record highs of more than 130 per MW overnight:

This emerging energy crisis is not just a European phenomenon. Asian and European gas consumers compete for supply on the global liquefied natural gas (LNG) market. So, what began as a European shortage has rippled across Asia, sending South Korean LNG benchmark prices sky-high:

A Crisis Rooted in Climate Activism
Historically, coal has provided a reliable backup fuel when gas supplies became tight. But no longer. The investment community has effectively written off coal as a dying and dirty fuel source in recent years. The rise of so-called “environmental, social and governance” (ESG) investment mandates started in the coal sector, before spreading into oil and gas more recently.
The ESG movement enjoys support from global governments and major policy-influencers, like the International Energy Agency (IEA). Earlier this year, the IEA published its widely-hyped path to “net zero” emissions by 2050. The agency forecasted aggressive secular declines in hydrocarbons, including a peak in coal-based power generation. As such, the IEA’s policy prescription called for zero investment in new oil, gas and coal development going forward.
So far, the IEA and other policymakers have been quite effective in curtailing new hydrocarbon supply. There’s just one glaring problem…
Policymakers have had zero impact on curtailing global hydrocarbon demand.
Everyone can agree on the goal of clean energy. But the simple reality is, major emerging economies, like India and China, show no signs of giving up on one of the cheapest fuel sources on the planet. Despite China talking a good game about cutting emissions, the country this year added a record volume of new coal-fired power capacity.
That’s why analysts are calling for 5% growth in coal-based power generation this year, followed by another 3% growth in 2022 to new record highs. Add it up, and it’s a simple equation: surging demand running into a supply-starved market = record high coal prices, providing little relief to gas-starved European and Asian economies:

Of course, don’t count on politicians or policy-makers learning any lessons here. My long-term bullish outlook on energy relies heavily on the fact that policymakers will continue pushing supply-side policies completely add odds with the realities on the demand side of the equation.
Politicians will remain immune to logic, even in the face of a full blown energy crisis Need proof? I present, exhibit A:
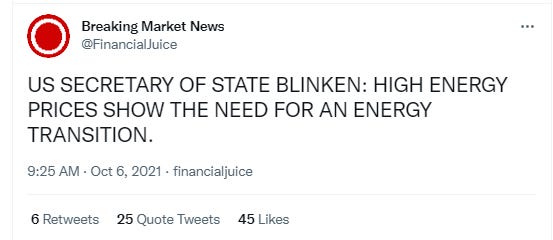
You can’t make this stuff up.
So, I fully expect sustained higher energy prices, and higher returns on capital for hydrocarbon investors going forward. And no, I don’t have any moral qualms about investing in companies that literally keep people from freezing to death in the winter.
Today’s global energy policies are terrible news for consumers, but terrific for investors.
But that’s a long-term thesis. In the shorter-term, this energy spike presents a major economic risk to all investors. Why? Because it threatens to seal the fate of today’s late stage economic expansion.
How a Boom Turns to Bust
Today’s global energy spike reflects one of the classic signs that points towards an imminent turn in the business cycle.
Let me explain, with a little economic theory…
Every economic expansion requires investment, and the necessary fuel for investment comes from savings. When the consumption of savings (via investment) matches the production of savings, the economy is balanced. But when consumption of savings exceeds the supply, you set into motion a boom/bust cycle.
As a brief aside, the interest rate provides the key economic price that balances the supply of and demand for savings and investment. In today’s modern era, central banks set into motion the boom/bust cycle through the artificial suppression of interest rates (although similar dynamics existed before central banks).
Getting back to the point at hand…
In the early stages of an economic boom, suppressed interest rates encourages the excess consumption of savings, via over-investment. This fuels a classic investment boom. But as the expansion drags on, the excess consumption of scarce resources results in shortages, and thus higher prices. Ultimately, higher prices are nothing more than a signal of resource shortages. Their job is to slow down the economy, providing an inflationary pin that pops the bubble. This gives rise to a recession, which is nothing more than a necessary period of under consumption - providing the savings fuel for the next investment cycle.
So, what’s the point?
The point is… the hallmark of a late stage economic boom is a sharp rise in prices - often led by energy. Consider a few brief examples…
Spiking Energy Prices - a Classic Late Cycle Signal
Let’s rewind the clock back to the late stage Dot Com melt-up. From January 1999 to March 2000, crude oil surged from $13 to $30 per barrel - a massive gain of 140%. This energy price spike pushed up the consumer price index (CPI) by 210 basis points, providing the inflationary pin that helped pop the Nasdaq bubble:

Fast forward to January 2007. Once again, just before the economy turned from boom to bust, crude oil embarked on an historic rally from $55 per barrel to an all-time high of over $140 by July 2008. This monster crude rally, along with broad-based gains across the commodities complex, pushed inflation up 340 basis points, helping pop the Housing Bubble:

As I’ve written about in the past, the bond market sniffed out the late cycle dynamics in 2007. As inflation raged throughout 2007, long-term Treasury yields peaked and entered into a steep downtrend. For more than 12 months before the 2008 Financial crisis, bond traders were betting that higher prices were indeed “transitory”, and that the red hot inflation of the day would ultimately give way to devastating deflation.
Now, fast forward to today.
Once again, energy prices are leading an inflationary impulse. We’ve already discussed the soaring gas and coal prices across Europe and Asia. But even here in the U.S., consumers are contending with oil prices doubling and natural gas prices nearly tripling from this time last year. Higher energy costs have been met with other price increases across the board, pushing inflation up a blistering 420 basis points in 12 months:

And yet, despite inflation running at over 5%, the 10-year yield cannot manage to clear 2% on the upside. The bond market is firing off stronger warning signals than those in 2007 and early 2008. The message: today’s inflation will cripple economic growth, and send the economy back into deflation.
Recent data suggests the bond market has gotten it exactly right. Here’s the latest Q3 GDP estimate from the Atlanta Fed, falling off a cliff:

In under two months, the forward outlook for economic growth has plunged from 6% to just over 1%. And yet, the U.S. is on Easy Street compared with Europe and Asia, whose economies are buckling under the stress of much higher energy prices.
Global Energy Crisis = Global Economic Slowdown
In Germany, spiking electricity costs are threatening to shut down industrial production across the board. As a leading indicator of the weakness ahead, German industrial orders in September registered a 7.7% monthly decline, versus a previous increase of 3.4%:

In China, electricity rationing is forcing a similar industrial slowdown. Reuters reported last week that 7% of the country’s aluminum capacity and 29% of cement production was recently pushed offline to conserve power. The output curbs have also impacted chemical, furniture and agricultural production, with capacity cuts expected in the paper and glass industries next.
The electricity shortage couldn’t come at a worse time for China, where the fallout from the collapsing property sector appears to be growing worse by the day. The following chart from TheLastBearStanding (@TheLastBearSta1 on Twitter - a must follow for tracking the Chinese property market meltdown) shows a total collapse in bond prices among China’s largest property developers. In other words, the contagion is spreading well beyond Evergrande:

The consensus belief says that the COVID-driven economic disruption in the Spring of 2020 marked a reset, which set the stage for a new expansion and new bull market.
I disagree.
Instead, policy-makers only prolonged an already-tired expansion with one final sugar high. The pandemic-driven supply chain disruptions created a uniquely damaging combination of supply shortages, just as record volumes of fiscal and monetary stimulus encouraged a consumption boom. Now, higher prices are doing their job - addressing a critical supply/demand imbalance, by forcing a retreat in consumption, and thus a retreat in economic growth.
The bottom line: I’m extremely bullish on energy over the long run. However, in the short run, today’s price increase will quickly becoming self-defeating. The only cure is a recession, and all signs indicate we’re running headlong in that direction.
How to Navigate This Market
Hit the subscribe button below to become a paid member, and gain access to a complete portfolio of ideas designed for playing the long-term energy bull market, while also hedging against potential turbulence in the shorter-term.
This is complex. Reading about FTDs. Leading up to 2008 recession, members of Congress invested in hedge funds that shorted Treasury bonds. By December, FTDs passed $2 trillion. Currently, FTDs at DTCC in US Government Agency Bonds are at a 52-week high. https://www.dtcc.com/charts/daily-total-us-treasury-trade-fails#qna
Ross, you wrote, "And yet, despite inflation running at over 5%, the 10-year yield cannot manage to clear 2% on the upside. The bond market is firing off stronger warning signals than those in 2007 and early 2008." Could you elaborate here? I'm now keeping an eye on $TYX. Who, specifically, do you mean by "the bond market" ... and why, in the face of inflationary pressures and resource shortages are bond yields not rising? Who is truly in control? (Thanks.)